When Smart People Misread Good Data: The Quiet Cost of Low Data Literacy in American Organizations

Photo by Photo by Campaign Creators on Unsplash on Unsplash
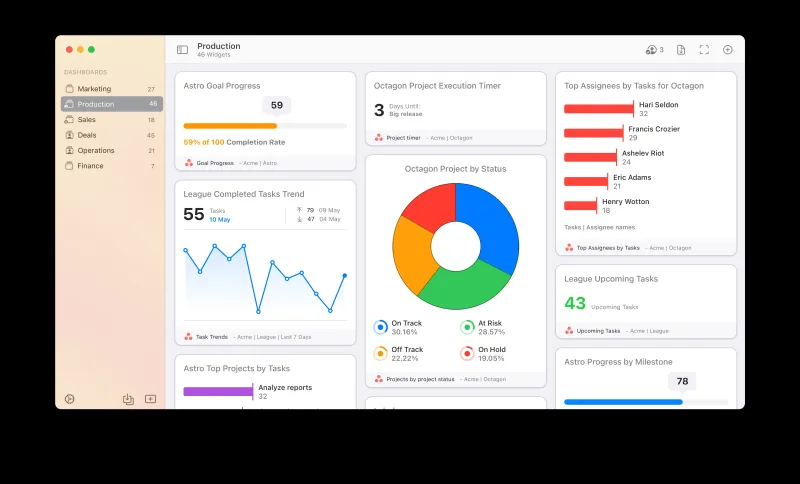
Organizations invest heavily in analytics infrastructure. They license business intelligence platforms, hire data engineers, and commission dashboards that consolidate dozens of KPIs into a single screen. Then a regional sales director misreads a year-over-year comparison, a product manager draws the wrong conclusion from a cohort analysis, and a decision worth seven figures moves in the wrong direction.
This is not a technology failure. It is a literacy failure — and it is far more common than most leadership teams are willing to admit.
The Gap Between Data Production and Data Understanding
According to research from Gartner, fewer than one in four employees feel confident working with data in their day-to-day roles. That figure is striking on its own. What makes it genuinely alarming is the context: these are the same employees who are handed dashboards, asked to interpret trend lines, and expected to translate quantitative signals into operational decisions.
The result is a quiet but persistent form of organizational waste. Analytics investments that were designed to sharpen decision-making instead produce a kind of informed confusion — where people engage with reports without truly understanding them, and where confidence in data outputs masks a fundamental misreading of what those outputs mean.
Consider a mid-sized distribution company in the Midwest that implemented a demand forecasting dashboard in 2022. Within six months, warehouse managers were using it daily. Within twelve, the company discovered that several teams had been conflating forecasted demand with confirmed purchase orders — a distinction the dashboard made visually, but not explicitly enough for non-technical readers. The downstream effect was excess inventory, elevated carrying costs, and a Q3 that significantly underperformed projections. The data had been correct. The interpretation had not.
Why This Problem Persists Despite Good Intentions
Most organizations approach data literacy as a training problem — something to be solved with a one-day workshop, an e-learning module, or a glossary document appended to a dashboard. These efforts are well-intentioned. They are also largely ineffective.
The reason is structural. Data literacy is not a body of knowledge that can be transferred in a single session. It is a set of habits, instincts, and mental models that develop through repeated, contextualized practice. When training is decoupled from the actual reports and decisions an employee encounters in their role, the knowledge does not transfer. It evaporates.
There is also a cultural dimension. In many organizations, admitting that you do not understand a chart or a metric carries implicit professional risk. Employees nod along in meetings, defer to whoever speaks most confidently about the numbers, and quietly make decisions based on incomplete or incorrect interpretations. The organizational norm of appearing data-savvy actively suppresses the kind of candid questioning that would expose and correct misunderstanding.
A Framework for Building Fluency Without Formal Programs
The most effective approaches to data literacy are embedded, role-specific, and low-friction. They do not require a training department, a learning management system, or a dedicated budget line. They require intentional design at the point where data meets decision.
Annotate reports at the point of use. Every dashboard deployed to non-technical users should include plain-language explanations of its key metrics — not definitions, but interpretive guidance. Instead of defining "customer acquisition cost," a well-annotated report tells the reader what a healthy range looks like, what drives fluctuation, and what action the metric is intended to inform. This converts a data display into a decision support tool.
Build metric fluency into existing workflows. Rather than scheduling separate training sessions, organizations can embed brief data discussions into meetings that are already happening. A fifteen-minute standing agenda item in a weekly operations review — focused on interpreting one metric together as a team — builds fluency incrementally and in context. Over time, this practice develops shared vocabulary and shared interpretive norms without requiring anyone to leave their desk.
Designate data translators at the team level. Not every employee needs to become analytically sophisticated. But every team benefits from having one person who bridges the gap between the data team and operational staff. This role does not require a technical background — it requires curiosity, communication skills, and sufficient access to the analysts who build the reports. Formalizing this informal role accelerates organizational fluency without centralizing the burden on the analytics function.
Create feedback loops between data consumers and data producers. When a manager misinterprets a report, that misinterpretation is valuable information for the team that built it. Establishing a lightweight mechanism for users to flag confusion — a shared channel, a feedback form embedded in the BI platform, a monthly review meeting — turns individual misreadings into systemic improvements. Reports become clearer. Metrics become better defined. Literacy improves as a byproduct of better design.
The Organizational Cost of Doing Nothing
For organizations that choose to treat data literacy as a secondary concern, the cost is real and compounding. Poor interpretation leads to poor decisions. Poor decisions erode trust in the analytics function. As trust erodes, adoption drops — and the investments made in data infrastructure return diminishing value. Eventually, leadership reverts to the intuition-driven approaches that analytics was supposed to replace.
This cycle is not hypothetical. It plays out regularly in organizations across the United States, and it represents one of the most underappreciated sources of analytics ROI destruction in the market today.
The good news is that the intervention does not need to be expensive or disruptive. It needs to be deliberate. Organizations that treat literacy as an infrastructure problem — something to be designed into their reporting systems, their meeting rhythms, and their team structures — consistently outperform those that treat it as a training problem to be delegated and forgotten.
Data is only as valuable as the decisions it informs. And decisions are only as good as the people making them can understand.